
Most people start with a mortgage calculator to estimate the affordability of a mortgage payment. That’s smart, but it’s also incomplete if you are not thinking beyond principal and interest.
A payment-only calculator answers: “Can I afford the mortgage?”
However, the bigger question is: “Does buying beat renting in this neighborhood over the time you plan to live there?”
That’s why we built the Buy vs Rent Calculator on Borrow Buy Build. It works through the basic mortgage calculator set up, then it forces the next level of thinking: rent alternatives + financial readiness + time horizon.
What a mortgage calculator gets right – and what it misses
A standard mortgage calculator helps you estimate principal and interest. That gives you a clean baseline. But the real world adds more layers, such as:
-
property taxes and homeowners insurance
-
HOA dues (if applicable)
-
FICO scores
-
debt to income
-
post closing reserves
So, if you only compare rent vs mortgage payment, you could talk yourself into a half baked analysis.

Step 1: Use the mortgage calculator mindset to build a baseline
Here’s the approach I recommend:
-
Run your numbers using a mortgage calculator baseline (price, down payment, rate, term).
-
Then, immediately add the “non-mortgage” factors (credit rating, debt to income, reserve capital, time horizon, and market appreciation).
-
Finally, compare that total ownership number against rent for the same neighborhood.
That last step matters because rent is your true alternative. In other words, renting isn’t “throwing money away” it’s the benchmark.
Step 2: Compare rent vs own in your neighborhood (not on the internet)
National headlines don’t make your bills. Your neighborhood does.
So pull rent comps the same way an appraiser pulls sales comps: similar home, nearby, recent. Use 3–5 comparable rentals and take the middle.
This matters even more because many studies show a wide gap between renting and buying in the short run, but the gap gap changes by metro.
For example, Bankrate found in 2025 that renting cost less than buying (based on average rent vs average mortgage payment) in all 50 largest U.S. metros, with the smallest gaps in places like Detroit/Philadelphia/Cleveland and the largest gaps in tech hubs like San Francisco/San Jose/Seattle.
Meanwhile, Redfin has reported a shrinking affordability gap between what buyers need to earn versus renters to afford monthly payments (a useful reminder that “monthly” is the pressure point for most households).
Takeaway: your calculator results should reflect your local rent reality, for an equal comparable property, not a generic assumption
Step 3: Think beyond the monthly mortgage – ownership costs beyond the payment
Here’s the “savvy” part most calculators ignore: every home charges rent.
It just charges it through maintenance, repairs, and replacements.
To estimate this, don’t guess. Use real research:
-
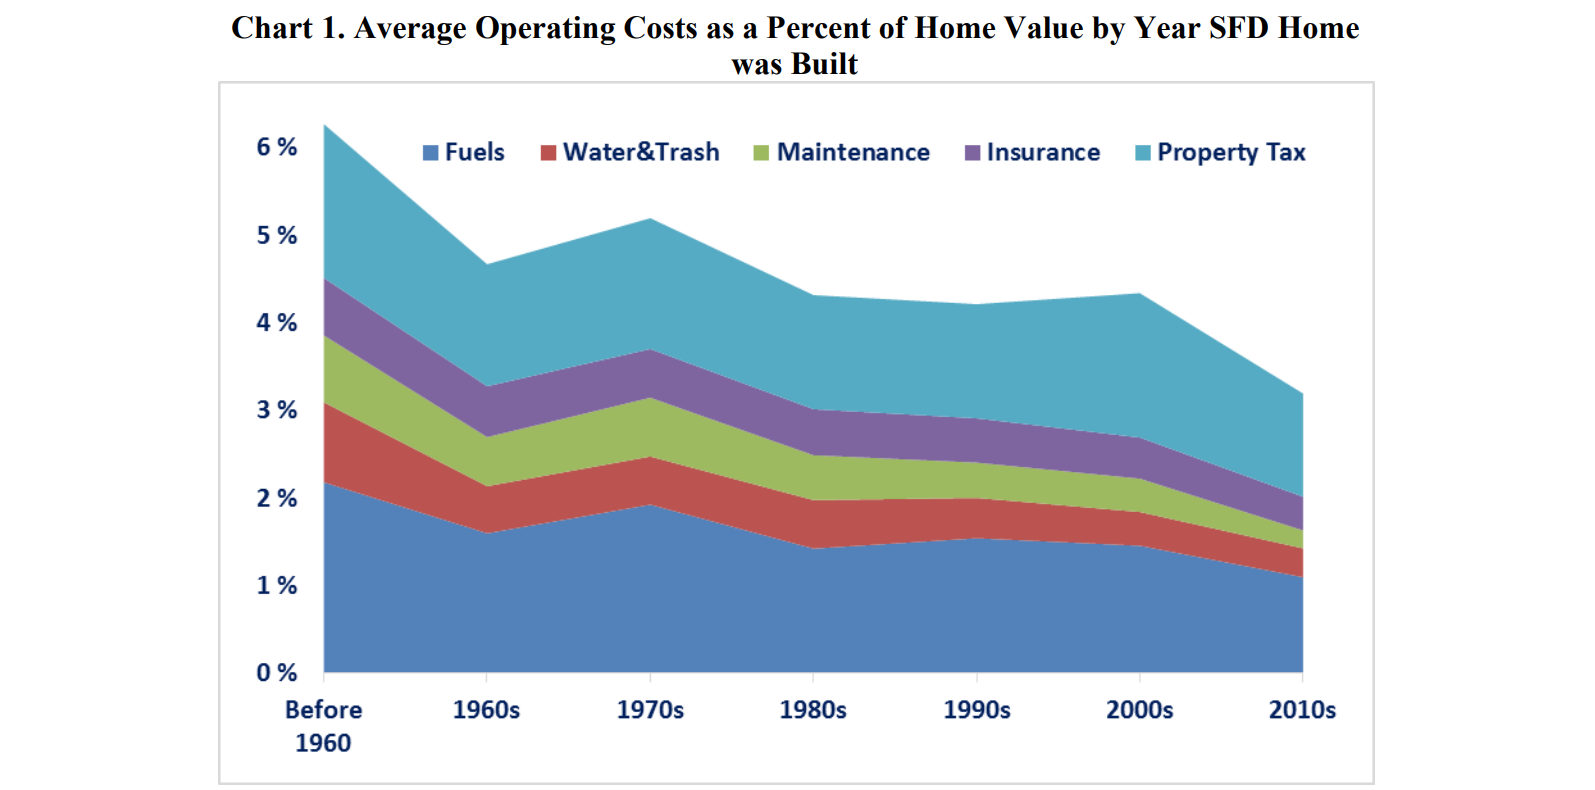
National Association of Home Builders analyzed American Housing Survey data and found annual operating costs (taxes, insurance, maintenance, utilities) average close to 5% of home value, with newer homes closer to 3% and older homes much higher.
-
U.S. Census Bureau notes that more than half of owners of older homes spent less than 1% of home value annually on home improvement and maintenance — but newer owners tended to spend more than long-time owners.
-
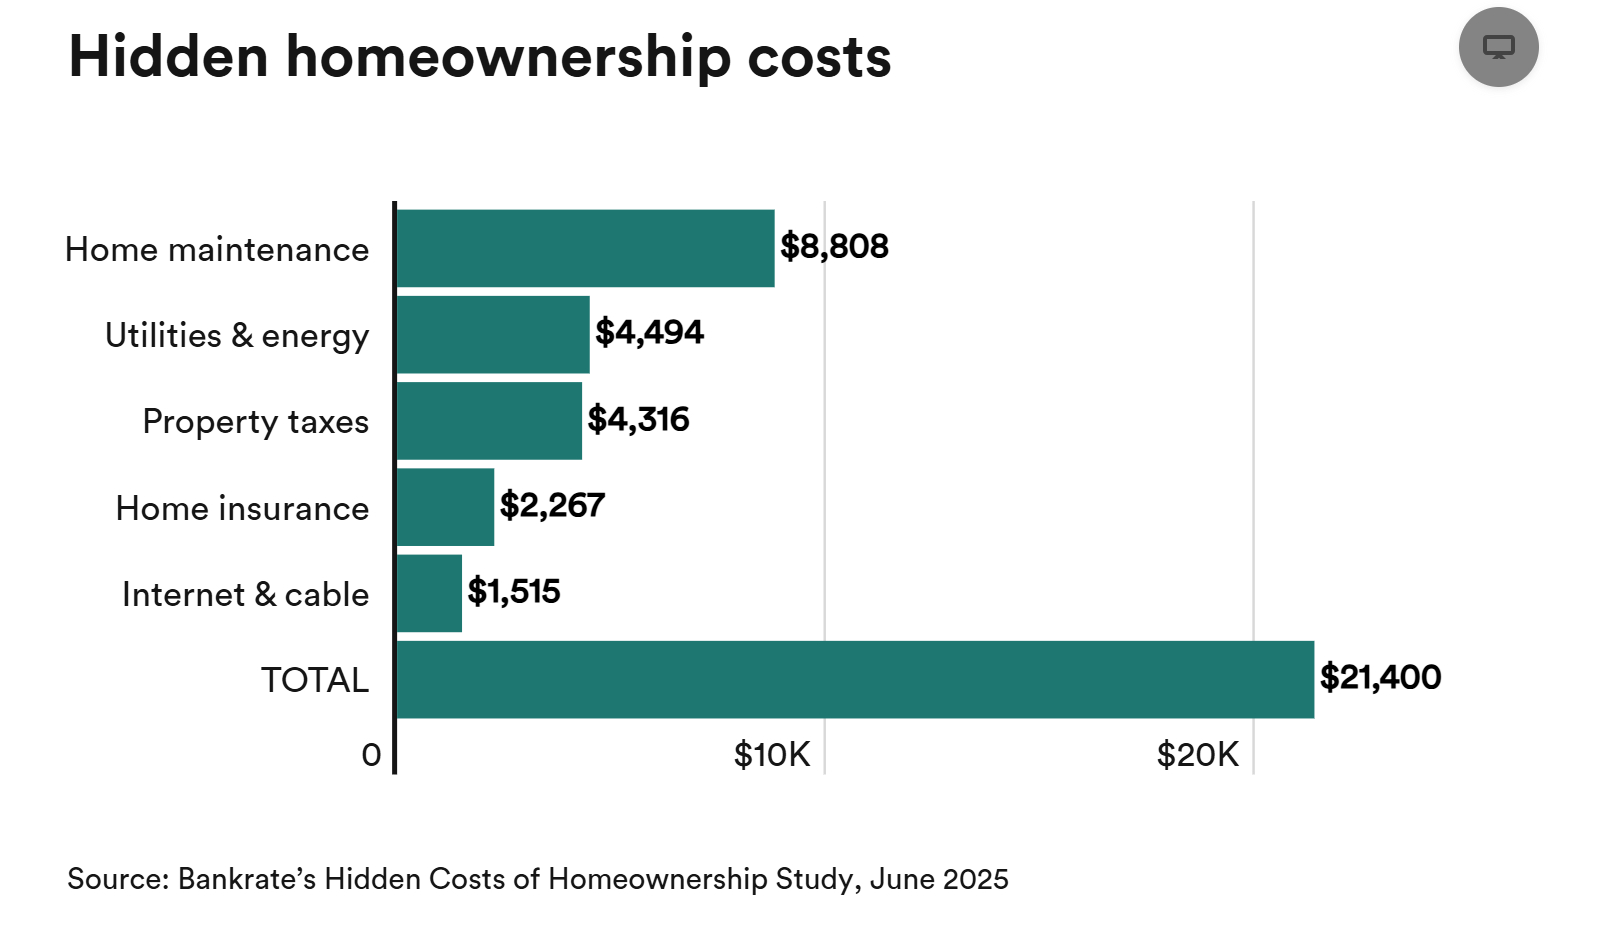
Bankrate also estimated “hidden” homeownership costs nationally (taxes, insurance, utilities, maintenance), including maintenance averaging over $8,800 per year as the largest component in their 2025 study.
So what number should you use? Run a range:
-
Conservative: lower maintenance assumption (newer home, strong condition, under builder warranty)
-
Realistic: mid-range assumption
-
Stress test: higher assumption (older home, big yard, pool, aging systems)
That’s a practical exercise a mortgage calculator does not provide.
Why this calculator helps you think beyond the principal and interest
A mortgage calculator gives you a payment. A buy vs rent calculator gives you perspective.
Specifically, it pushes you to answer questions like:
-
If I rented a similar home nearby, what would I pay monthly?
-
If rent increases over time, how does that change the math?
-
If I stay 3 years vs 7 years, does the break-even move?
-
What are the minimal expenses for the next 2 years?
-
Do I value flexibility more than equity in this season?
Also, rent inflation is real. The Bureau of Labor Statistics explains how CPI tracks rent and owners’ equivalent rent, which helps you ground rent growth assumptions instead of guessing.
A simple way to use the calculator
Run three versions so you don’t fool yourself:
-
Short stay (2–3 years) — higher chance renting wins short-term
-
Likely stay (5–7 years) — true “break-even” window
-
Long stay (10+ years) — equity and rent growth matter more
Then compare outcomes. If buying “wins” only in the optimistic case, you have your answer. Remember the purchase and sale of real estate is an expensive proposition.
Next step
Use the Buy vs Rent Calculator as your smarter mortgage calculator, the one that forces a real comparison, not just a payment.

FAQ: Mortgage Calculator vs Buy vs Rent Calculator
What does a mortgage calculator actually calculate?
A mortgage calculator usually estimates principal + interest (and sometimes taxes/insurance if you add them). However, it doesn’t automatically account for maintenance, repairs, HOA, closing costs, or selling costs—which is why “payment” alone can mislead you.
Why compare my mortgage payment to rent in the same neighborhood?
Because rent is your real alternative. In other words, you don’t compete against “national averages” you compete against what it costs to rent a similar home nearby. That’s why you should pull 3–5 comparable rentals and use the middle number as your benchmark.
If renting is cheaper monthly, does that mean renting is always better?
Not necessarily. In the short run, renting often costs less per month in many metros, but lifestyle goals, time horizon, and equity can change the result. For example, Bankrate’s 2025 study found renting was cheaper than buying (monthly) in all 50 of the largest U.S. metros.
That’s exactly why you should run both scenarios rather than rely on slogans.
How much should I budget for maintenance and repairs?
Plan a range, based on the age of the property, then test it. Averages can help, but your home’s age and condition matter more.
-
Bankrate estimated home maintenance averages $8,800/year nationally in 2025 (as part of “hidden costs”).
-
NAHB’s analysis of AHS data found annual operating costs average close to 5% of home value, and newer homes trend lower (about 3%).
-
The U.S. Census Bureau notes more than half of owners of older homes spent less than 1% of value annually on improvement/maintenance, while new owners tended to spend more.
So, use something like low / medium / high maintenance assumptions in your calculator runs to avoid false confidence.
How should I estimate rent growth over time?
Use a conservative assumption and a research the local market. Also, remember rent doesn’t rise evenly every year. The markets swing. For background on how rent is measured in inflation data, the BLS explains rent and owners’ equivalent rent methodology in its CPI factsheet.
How long do I need to stay for buying to “break even”?
It depends on your closing costs, rent level, and ownership costs. Still, a practical approach is to run stays of 3, 7 and 10 years.
If buying only “wins” in the 10-year scenario, you’ve learned something important.
Where can I find credible data for appreciation or market trends?
For broad appreciation trends (national, state, metro), the FHFA House Price Index is a strong public data source.
Meanwhile, if you want rent-versus-buy affordability pressure in the current market, Redfin publishes periodic research on income needed to buy vs rent.


